Reports Overview
The Reports Module provides a comprehensive view of your organization’s financial and operational performance. It is divided into multiple tabs, each focusing on a specific aspect of performance.
🔎 Filters & Controls
📅 Date Range Filter
Select a specific date range to focus on historical or future performance.
📍 Location Filter
Choose one location to see localized reporting.
🏢 Product Type Filter
Filter reports by product type such as:
- Offices, Meeting Rooms, Workstations, Admin, Deposits, Benefits etc
📊 Compare Filter
Compare metrics across two locations or product types to identify differences or trends.
🗂️ Tabs Overview
1. 📈 Revenue & Profit Report
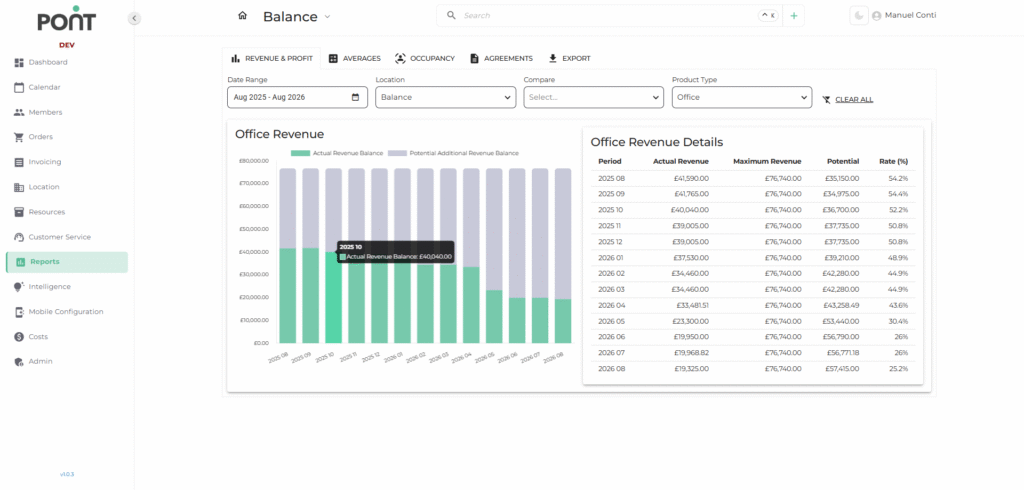
Track revenue trends and potential growth over time.
- Charts: Visual comparison of Actual Revenue vs Potential Revenue.
- Details Table: Shows Period, Actual Revenue, Maximum Revenue, Potential Revenue, and Revenue Rate (%).
2. 📊 Averages Report
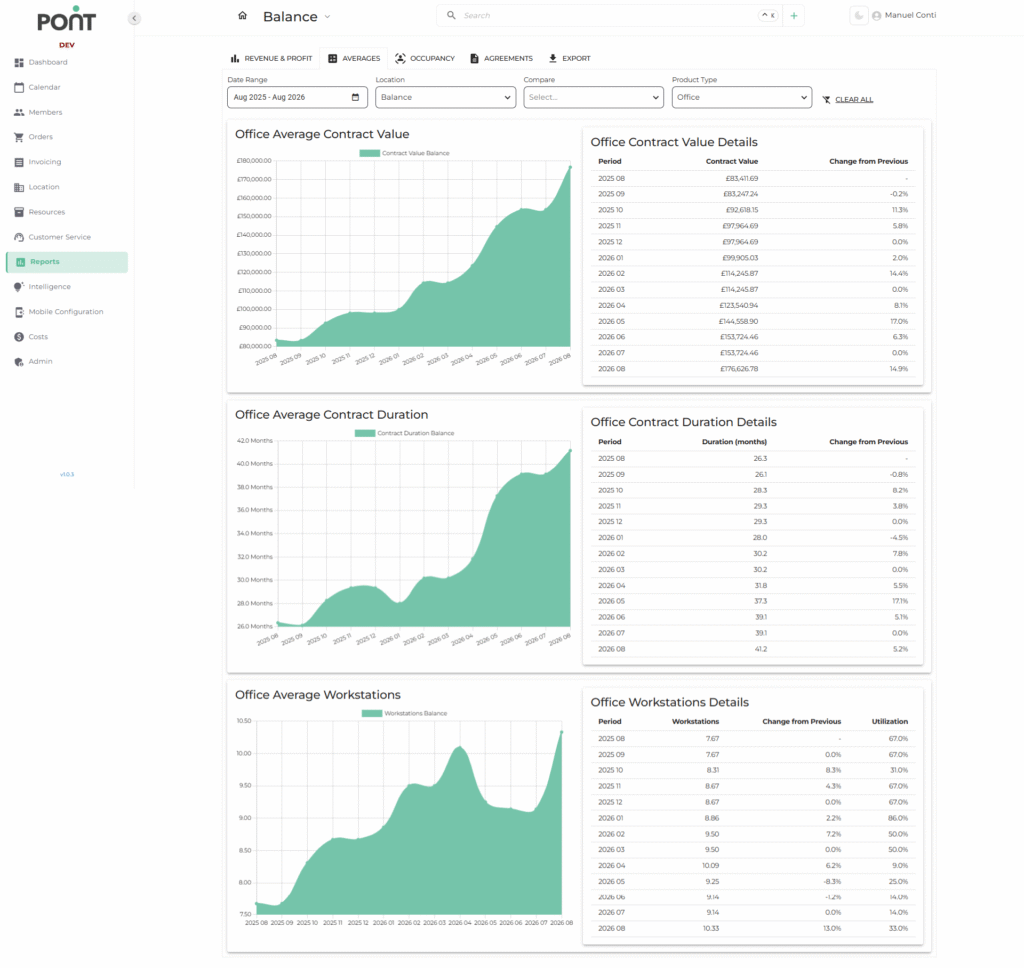
Monitor and analyze average metrics over selected periods.
- Key Metrics:
- Average Contract Value: Displays the average contract value trend.
- Average Contract Duration: Shows the average length of active contracts.
- Average Workstations: Tracks the average number of occupied workstations.
- Details Table: Lists values for each period with changes compared to the previous period.
3. 📉 Occupancy Report
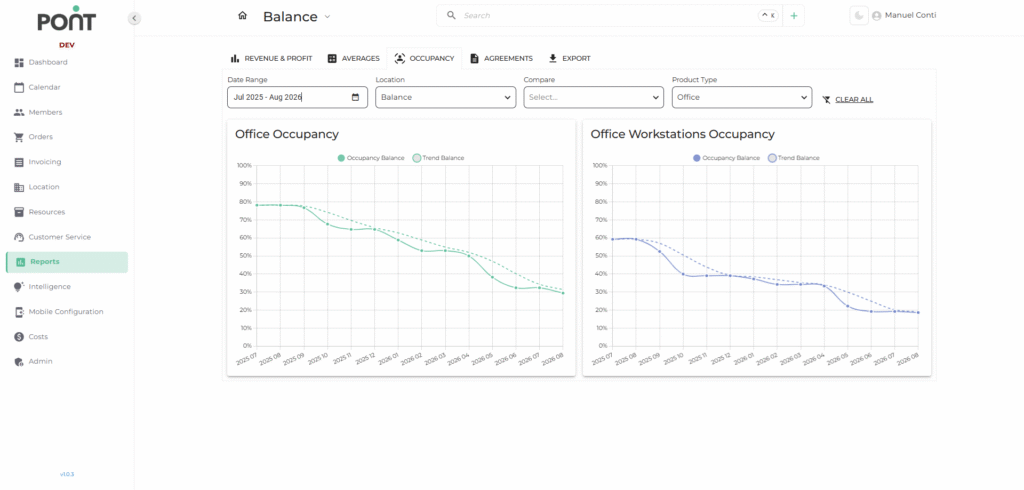
Understand utilization levels across resources.
- Charts:
- Office Occupancy: Shows actual vs trend occupancy rates.
- Workstations Occupancy: Highlights workstation utilization trends.
- Insights: Helps optimize resource allocation and identify underutilized spaces.
4. 📜 Agreements Report
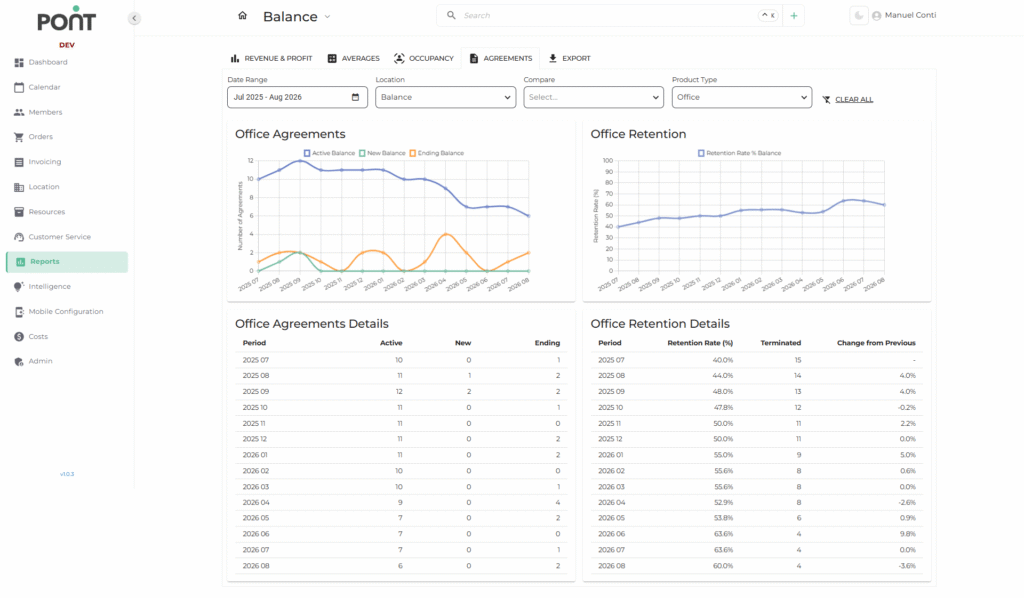
Track contract and customer retention performance.
- Charts:
- Agreements Overview: Visualizes active, new, and ending agreements.
- Retention Trends: Tracks retention rates over time.
- Details Table: Provides period-wise breakdown of Active, New, Ending, and Terminated agreements with retention rate.
5. 📥 Export
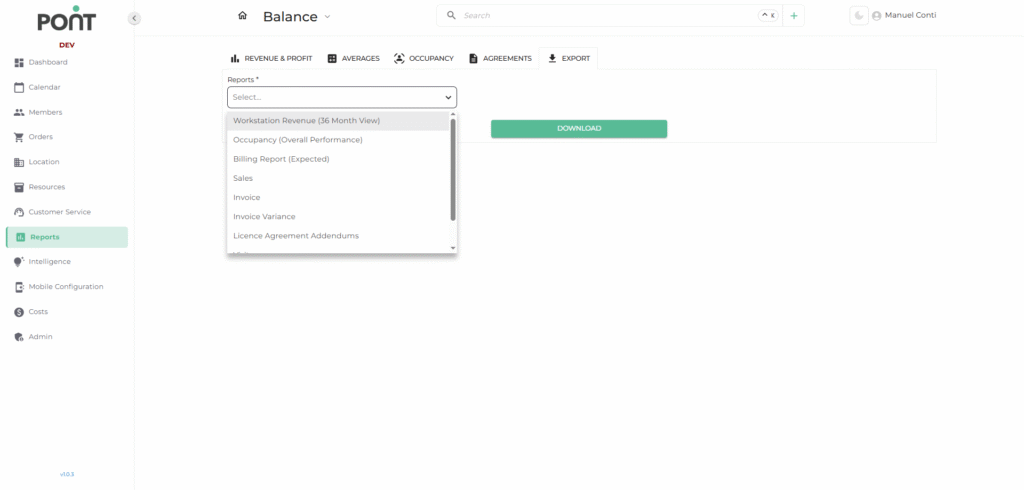
The Export tab allows you to download specific pre-defined reports in various formats for analysis, record-keeping, and sharing.
These reports provide valuable insights into different operational areas such as revenue, occupancy, billing, and customer activity.
📋 Available Export Options
- Workstation Revenue (36-Month View)
Generates a report detailing revenue trends for workstations over the past 36 months.
Ideal for tracking long-term revenue performance for shared workstations. - Occupancy (Overall Performance)
Provides a comprehensive view of occupancy levels for all resources (meeting rooms, offices, workstations) over the selected period.
Useful for understanding space utilization trends. - Billing Report (Expected)
Shows projected billing amounts based on active agreements, before actual invoicing.
Helps in forecasting future cash flow. - Sales
Lists details of all sales transactions within the chosen date range, including product type and revenue generated.
Supports sales performance tracking. - Invoice
Exports a list of all generated invoices for the selected period.
Useful for reconciliation, compliance, and accounting purposes. - Invoice Variance
Highlights discrepancies between expected invoice amounts and actual invoices issued.
Helps in identifying billing errors or adjustments. - Licence Agreement Addendums
Produces a record of all licence agreement addendums created within the specified period.
Essential for compliance and contract auditing. - Visitors
Provides data on visitor activity across locations for the selected timeframe.
Useful for tracking foot traffic and managing visitor policies. - Benefits
Exports a summary of additional benefits or value-added services utilized by members or customers.
Supports analysis of perks usage and resource planning.